LogCpTransformer#
LogCpTransformer() applies the transformation log(x + C), where x is the
variable to transform and C is a positive constant that shifts the distribution towards
positive values.
LogCpTransformer() is an extension of LogTransformer() that allows
adding a constant to move distributions towards positive values. For more details about
the logarithm transformation, check out the LogTransformer()’s user Guide.
Defining C#
You can enter the positive quantity to add to the variable as a dictionary, where the keys are the variable names, and the values are the constant to add to each variable. If you want to add the same value to all variables, you can pass an integer or float, instead.
Alternatively, the LogCpTransformer() will find the necessary value to make all
values of the variable positive. For strictly positive variables, C will be 0, and the
transformation will be log(x).
Python example#
Let’s check out the functionality of LogCpTransformer().
Transforming strictly positive variables#
Let’s load the California housing dataset that comes with Scikit-learn and separate it into train and test sets.
import pandas as pd
import matplotlib.pyplot as plt
from sklearn.model_selection import train_test_split
from sklearn.datasets import fetch_california_housing

from feature_engine.transformation import LogCpTransformer

# Load dataset
X, y = fetch_california_housing( return_X_y=True, as_frame=True)

# Separate into train and test sets
X_train, X_test, y_train, y_test =  train_test_split(
    X, y, test_size=0.3, random_state=0)
Now we want to apply the logarithm to 2 of the variables in the dataset using the
LogCpTransformer(). We want the transformer to detect automatically the
quantity “C” that needs to be added to the variable:
# set up the variable transformer
tf = LogCpTransformer(variables = ["MedInc", "HouseAge"], C="auto")

# fit the transformer
tf.fit(X_train)
With fit() the LogCpTransformer() learns the quantity “C” and stores it as
an attribute. We can visualise the learned parameters as follows:
# learned constant C
tf.C_
As these variables are strictly positive, the transformer will add 0 to the variables before applying the logarithm transformation:
{'MedInc': 0, 'HouseAge': 0}
In this case, the transformation applied by LogCpTransformer() is the same as
using LogTransformer() because these variables are strictly positive.
We can now go ahead and transform the variables:
# transform the data
train_t= tf.transform(X_train)
test_t= tf.transform(X_test)
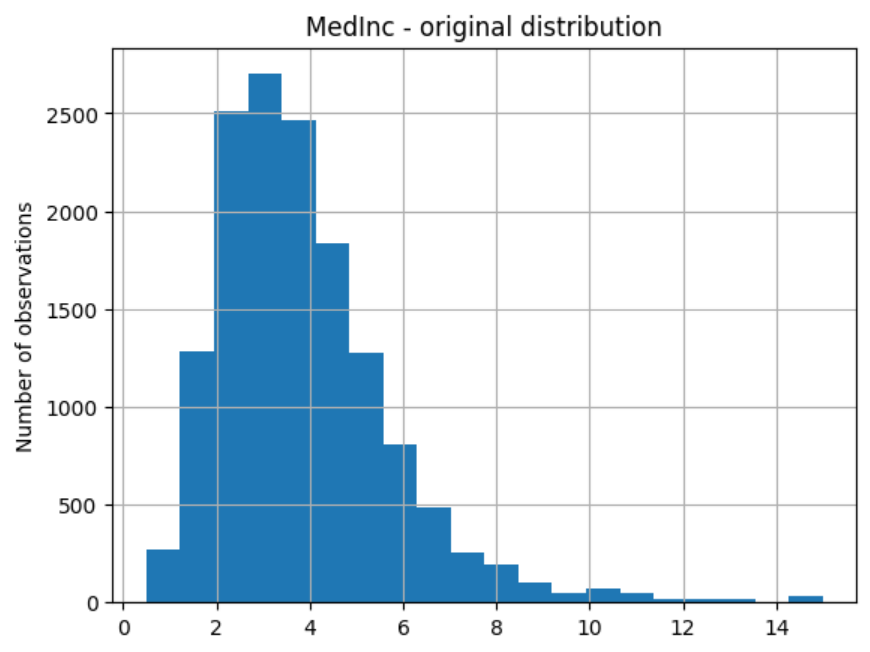
Then we can plot the original variable distribution:
# un-transformed variable
X_train["MedInc"].hist(bins=20)
plt.title("MedInc - original distribution")
plt.ylabel("Number of observations")
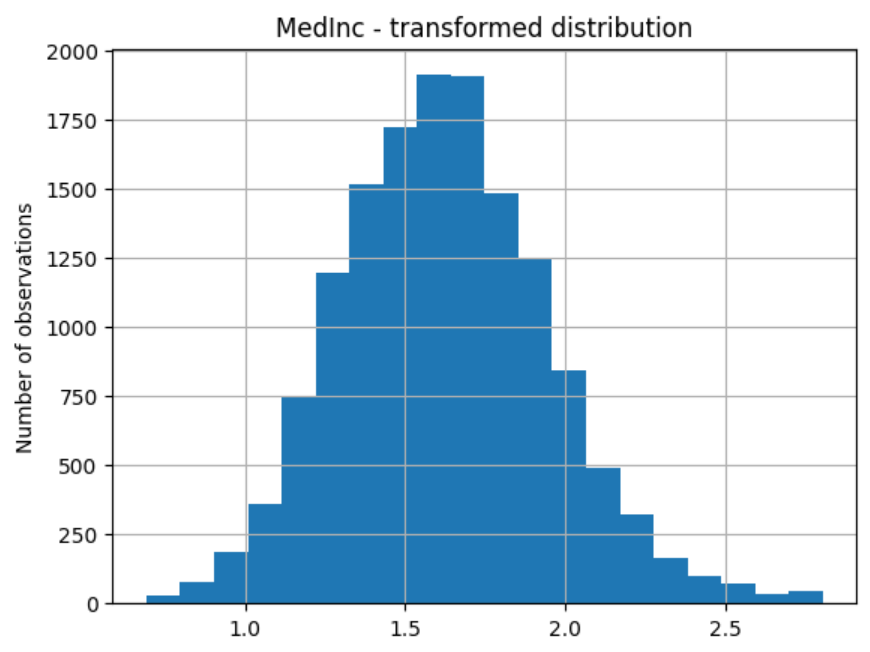
And the distribution of the transformed variable:
# transformed variable
train_t["MedInc"].hist(bins=20)
plt.title("MedInc - transformed distribution")
plt.ylabel("Number of observations")
Transforming non-strictly positive variables#
Let’s now show the functionality of LogCpTransformer() with variables that contain
values lower or equal to 0. Let’s load the diabetes dataset:
import pandas as pd
import matplotlib.pyplot as plt
from sklearn.model_selection import train_test_split
from sklearn.datasets import load_diabetes
from feature_engine.transformation import LogCpTransformer

# Load dataset
X, y = load_diabetes( return_X_y=True, as_frame=True)

# Separate into train and test sets
X_train, X_test, y_train, y_test =  train_test_split(
    X, y, test_size=0.3, random_state=0)
Let’s print out a summary of the main characteristics of 2 of the variables:
print(X_train[["bmi", "s3"]].describe())
In the following output we see that the variables contain negative values:
              bmi          s3
count  309.000000  309.000000
mean    -0.001298    0.000511
std      0.048368    0.048294
min     -0.084886   -0.102307
25%     -0.036385   -0.032356
50%     -0.008362   -0.006584
75%      0.030440    0.030232
max      0.170555    0.181179
Let’s now set up LogCpTransformer() to shift the variables’ distribution to
positive values and then apply the logarithm:
tf = LogCpTransformer(variables = ["bmi", "s3"], C="auto")
tf.fit(X_train)
We can inspect the constant values that will be added to each variable:
tf.C_
Since these variables were not strictly positive, LogCpTransformer() found
the minimum value needed to make their values positive:
{'bmi': 1.0848862355291056, 's3': 1.102307050517416}
We can now transform the data:
train_t= tf.transform(X_train)
test_t= tf.transform(X_test)
Let’s plot bmi before the transformation:
X_train["bmi"].hist(bins=20)
plt.title("bmi - original distribution")
plt.ylabel("Number of observations")
In the following image we see the original distribution of bmi:

Let’s now plot the transformed variable:
# transformed variable
train_t["bmi"].hist(bins=20)
plt.title("bmi - transformed distribution")
plt.ylabel("Number of observations")
In the following image we see the distribution of bmi after the transformation:

Adding the same constant to all variables#
You can add the same constant to all variables by setting up LogCpTransformer()
as follows:
tf = LogCpTransformer(C=5)
tf.fit(X_train)
In this case, all numerical variables will be transformed. We can find the variables that
will be transformed in the variables_ attribute:
tf.variables_
All numerical variables were selected for the transformation:
['age', 'sex', 'bmi', 'bp', 's1', 's2', 's3', 's4', 's5', 's6']
You can now apply transform() to transform all these variables.
Adding different user defined constants#
If you want to add specific values to specific variables, you can do so by setting
LogCpTransformer() as follows:
tf = LogCpTransformer(C={"bmi": 2, "s3": 3, "s4": 4})
tf.fit(X_train)
In this case, LogCpTransformer() will only modify the variables indicated in the
dictionary:
tf.variables_
The variables in the dictionary will be transformed:
['bmi', 's3', 's4']
And the constant values will be those from the dictionary:
tf.C_
C_ coincides with the values entered in C:
{'bmi': 2, 's3': 3, 's4': 4}
You can now apply transform() to transform all these variables.
Tutorials, books and courses#
You can find more details about the LogCpTransformer() here:
For tutorials about this and other data transformation methods, like the square root transformation, power transformations, the box cox transformation, check out our online course:

Feature Engineering for Machine Learning#
Or read our book:
Python Feature Engineering Cookbook#
Both our book and course are suitable for beginners and more advanced data scientists alike.