Quick Start#
If you’re new to feature-engine this guide will get you started. Feature-engine
transformers have the methods fit() and transform() to learn parameters from the
data and then modify the data. They work just like any scikit-learn transformer.
Installation#
Feature-engine is a Python 3 package and works well with 3.9 or later. You can install
feature-engine with pip:
$ pip install feature-engine
Note you can also install it with a _ as follows:
$ pip install feature_engine
Feature-engine is an active project and routinely publishes new releases. To upgrade
feature-engine to the latest version, use pip as follows:
$ pip install -U feature-engine
If you’re using Anaconda, you can install the Anaconda feature-engine package:
$ conda install -c conda-forge feature_engine
Once installed, you should be able to import feature-engine without an error, both in Python and in Jupyter notebooks.
Example Use#
This is an example of how to use feature-engine’s transformers to perform missing data imputation.
import pandas as pd
import matplotlib.pyplot as plt
from sklearn.datasets import fetch_openml
from sklearn.model_selection import train_test_split

from feature_engine.imputation import MeanMedianImputer

# Load dataset
X, y = fetch_openml(
    name="house_prices",
    version=1,
    as_frame=True,
    return_X_y=True
)

# Separate into train and test sets
X_train, X_test, y_train, y_test = train_test_split(
    X,
    y,
    test_size=0.3,
    random_state=0,
)

# set up the imputer
median_imputer = MeanMedianImputer(
    imputation_method='median',
    variables=['LotFrontage', 'MasVnrArea']
)

# fit the imputer
median_imputer.fit(X_train)

# transform the data
train_t = median_imputer.transform(X_train)
test_t = median_imputer.transform(X_test)

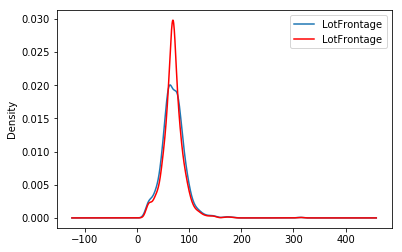
# plot a variable distribution before and after imputation
fig = plt.figure()
ax = fig.add_subplot(111)
X_train['LotFrontage'].plot(kind='kde', ax=ax)
train_t['LotFrontage'].plot(kind='kde', ax=ax, color='red')
lines, _ = ax.get_legend_handles_labels()
labels = ["original", "imputed"]
ax.legend(lines, labels, loc='best')
plt.title("Variable LotFrontAge before and after the imputation")
plt.show()
In the following output, we see the distribution of one of the imputed variables, before and after the imputation:
Feature-engine within scikit-learn’s pipeline#
Feature-engine’s transformers can be assembled within a scikit-learn pipeline. This way, we can store our entire feature engineering pipeline in one single object or pickle (.pkl). Here is an example of how to do it:
import numpy as np

from sklearn.datasets import fetch_openml
from sklearn.linear_model import Lasso
from sklearn.metrics import mean_squared_error
from sklearn.model_selection import train_test_split
from sklearn.pipeline import Pipeline as pipe
from sklearn.preprocessing import MinMaxScaler

from feature_engine.encoding import RareLabelEncoder, MeanEncoder
from feature_engine.discretisation import DecisionTreeDiscretiser
from feature_engine.imputation import (
    AddMissingIndicator,
    MeanMedianImputer,
    CategoricalImputer,
)

# Load dataset
X, y = fetch_openml(
    name="house_prices",
    version=1,
    as_frame=True,
    return_X_y=True
)

# Drop some variables
X.drop(
    labels=['YearBuilt', 'YearRemodAdd', 'GarageYrBlt', 'Id'],
    axis=1,
    inplace=True,
)

# Make a list of categorical variables
categorical = [var for var in X.columns if X[var].dtype == 'O']

# Make a list of numerical variables
numerical = [var for var in X.columns if X[var].dtype != 'O']

# Make a list of discrete variables
discrete = [var for var in numerical if len(X[var].unique()) < 20]

# Make a list of continuous variables
numerical = [var for var in numerical if var not in discrete]

# Separate data into training and test sets
X_train, X_test, y_train, y_test = train_test_split(
    X,
    y,
    test_size=0.1,
    random_state=0
)

# Set up the pipeline
price_pipe = pipe([
    # Add a binary variable to flag NA in one variable
    ('continuous_var_imputer', AddMissingIndicator(variables=['LotFrontage'])),

    # Replace NA with the median in 2 variables
    ('continuous_var_median_imputer', MeanMedianImputer(
        imputation_method='median', variables=['LotFrontage', 'MasVnrArea']
    )),

    # Replace NA by adding the label "Missing" in categorical variables
    ('categorical_imputer', CategoricalImputer(variables=categorical)),

    # Disretise continuous variables using decision trees
    ('numerical_tree_discretiser', DecisionTreeDiscretiser(
        cv=3,
        scoring='neg_mean_squared_error',
        variables=numerical,
        regression=True)),

    # Group rare labels in categorical and discrete variables
    ('rare_label_encoder', RareLabelEncoder(
        tol=0.03,
        n_categories=1,
        variables=categorical+discrete,
        ignore_format=True,
    )),

    # Encode categorical and discrete variables using the target mean
    ('categorical_encoder', MeanEncoder(variables=categorical+discrete, ignore_format=True)),

    # Scale features
    ('scaler', MinMaxScaler()),

    # Lasso regression
    ('lasso', Lasso(random_state=2909, alpha=0.005))

])

# Fit feature engineering transformers and Lasso
price_pipe.fit(X_train, np.log(y_train))

# Predict
pred_train = price_pipe.predict(X_train)
pred_test = price_pipe.predict(X_test)

# Evaluate
print('Lasso Linear Model train mse: {}'.format(
    mean_squared_error(y_train, np.exp(pred_train))))
print('Lasso Linear Model train rmse: {}'.format(
    np.sqrt(mean_squared_error(y_train, np.exp(pred_train)))))
print()
print('Lasso Linear Model test mse: {}'.format(
    mean_squared_error(y_test, np.exp(pred_test))))
print('Lasso Linear Model test rmse: {}'.format(
    np.sqrt(mean_squared_error(y_test, np.exp(pred_test)))))
In the following output, we see the mean squared error and RMSE of the LASSO on the training and test sets:
Lasso Linear Model train mse: 949189263.8948538
Lasso Linear Model train rmse: 30808.9153313591

Lasso Linear Model test mse: 1344649485.0641973
Lasso Linear Model test rmse: 36669.46256852147
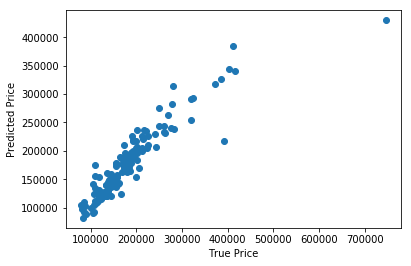
Let’s now plot the predictions vs the actuals:
import matplotlib.pyplot as plt

plt.scatter(y_test, np.exp(pred_test))
plt.xlabel('True Price')
plt.ylabel('Predicted Price')
plt.show()
In the following output, we see the predictions vs the actuals: